- Hub
- Data Analysis
- Community
- Legal
- Support
Light
Dark
System
 INVESTOR BILL OF RIGHTSJoin our movement for Transparency, Simplicity, Choice & Control, Best Execution, and Better Settlement & Clearing
Appearance
- SPYSPY
4.66%
- QQQQQQ
0.73%
- DIADIA
3.85%
- IWMIWM
6.33%
- VXZVXZ
10.47%


All brokers in one place!
Connect your portfolio to gain the insights from all your brokers in one place and save time


This post is to be updated with links when necessary, so check back for more!
Welcome to Urvin!
Whether you're new here, or brushing up on your skills, the Start Here community is a place for you to find your feet before diving deeper in to Urvin. And this is your definitive guide!
So we'll start with a full tour for the visual learners!
Here's a full platform tour on an episode of our podcast, Let's Talk Markets. While you're there, be sure to like and subscribe to stay updated on our weekly episodes!
https://www.youtube.com/embed/zYaRgZ4W5-k?si=Hh0Jx-iQXkbIKyO-
For more educational information, check out these resources
You can join the Urvin Ed community
You can follow Urvin Ed's profile
Check out the Markets 101 series
Ready to unlock a more personalized data and community experience? Connect your portfolio!
https://www.youtube.com/embed/eYYZhwh739I?si=kfDoPwrIWu_mtImC
Verified Shareholder Communities
Verified Shareholder Communities are here!
For more information on how VSCs work, check out the Markets 101 piece.
Urvin's Connected Accounts Security Disclosure
Our connected accounts security disclosure can be found here.
There are no securities yet, add your first one by clicking star icon on any security
You don't have any connected portfolios yet. Please start by connecting a portfolio.
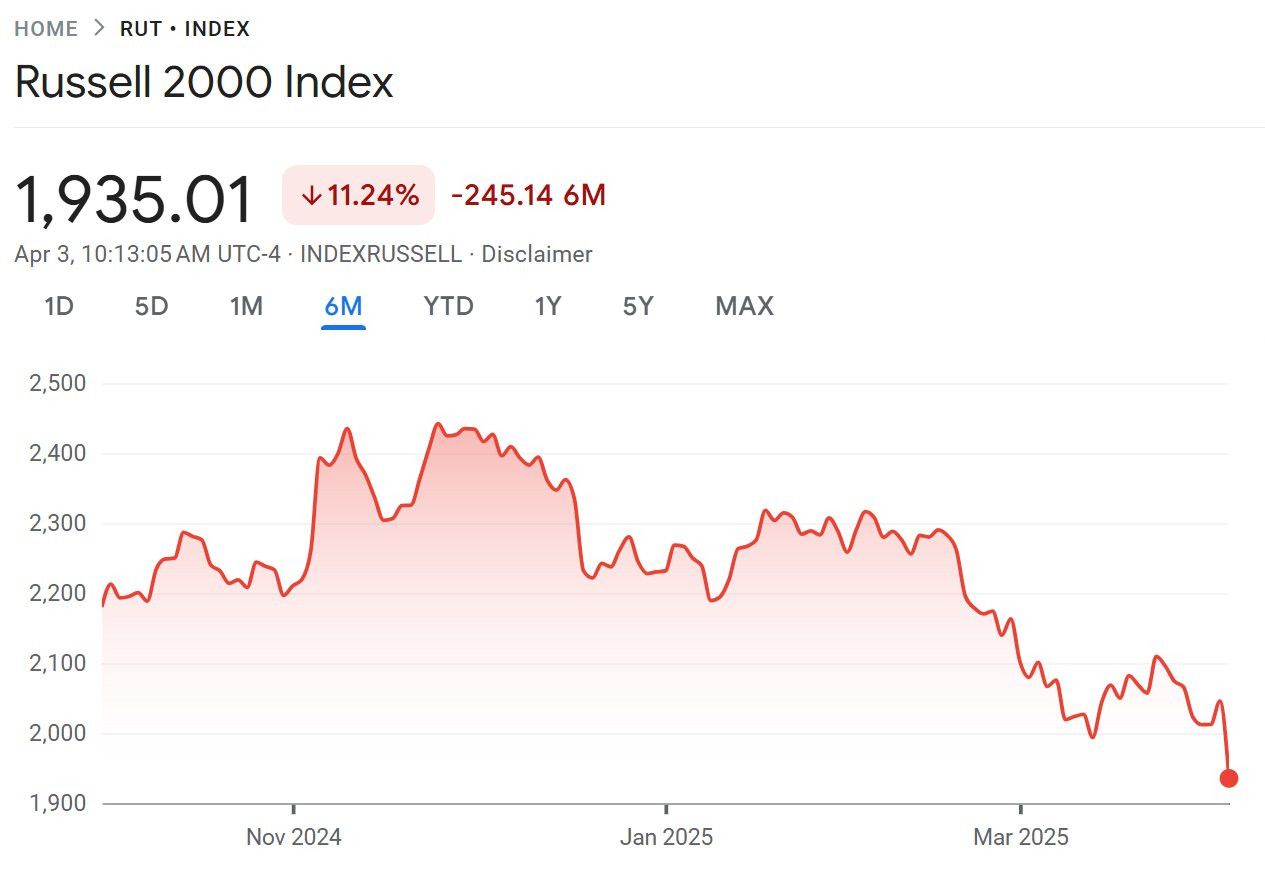
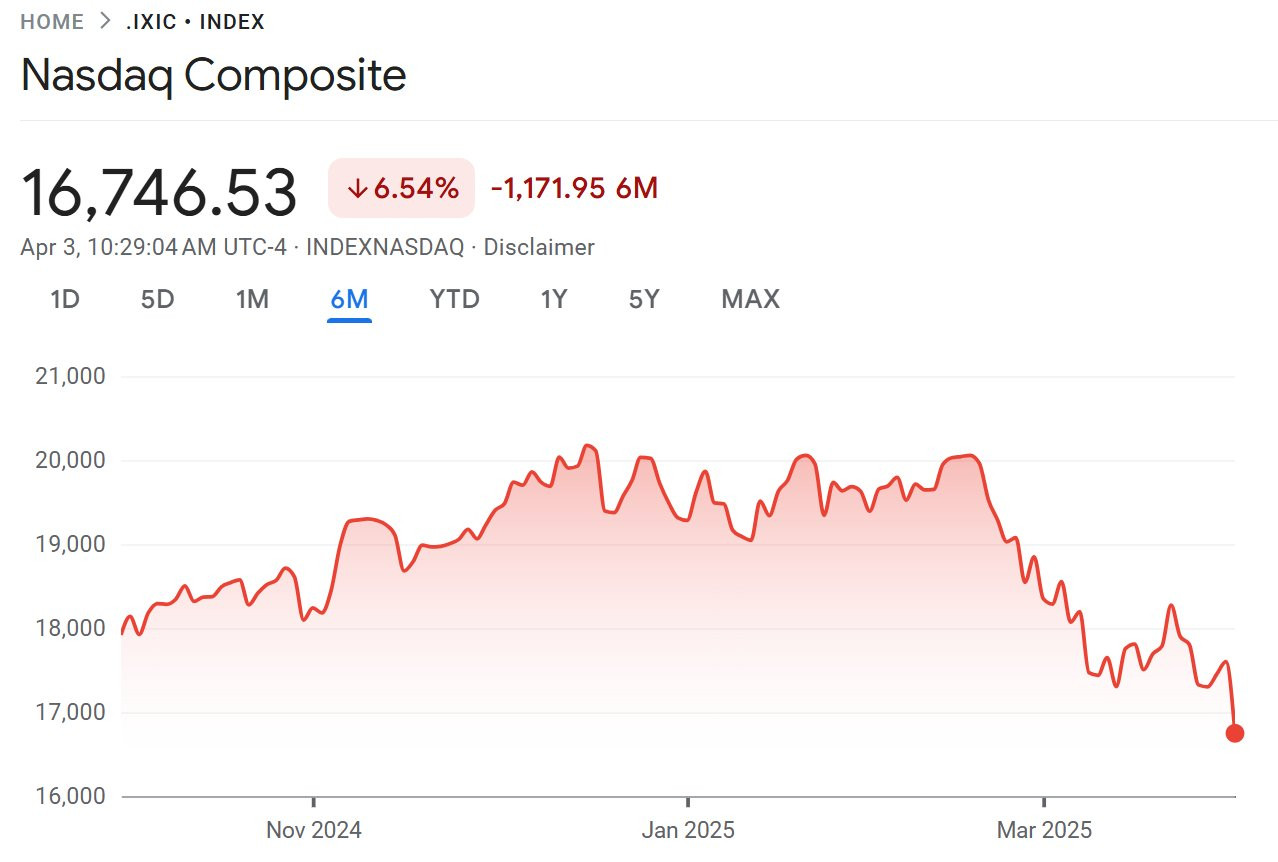
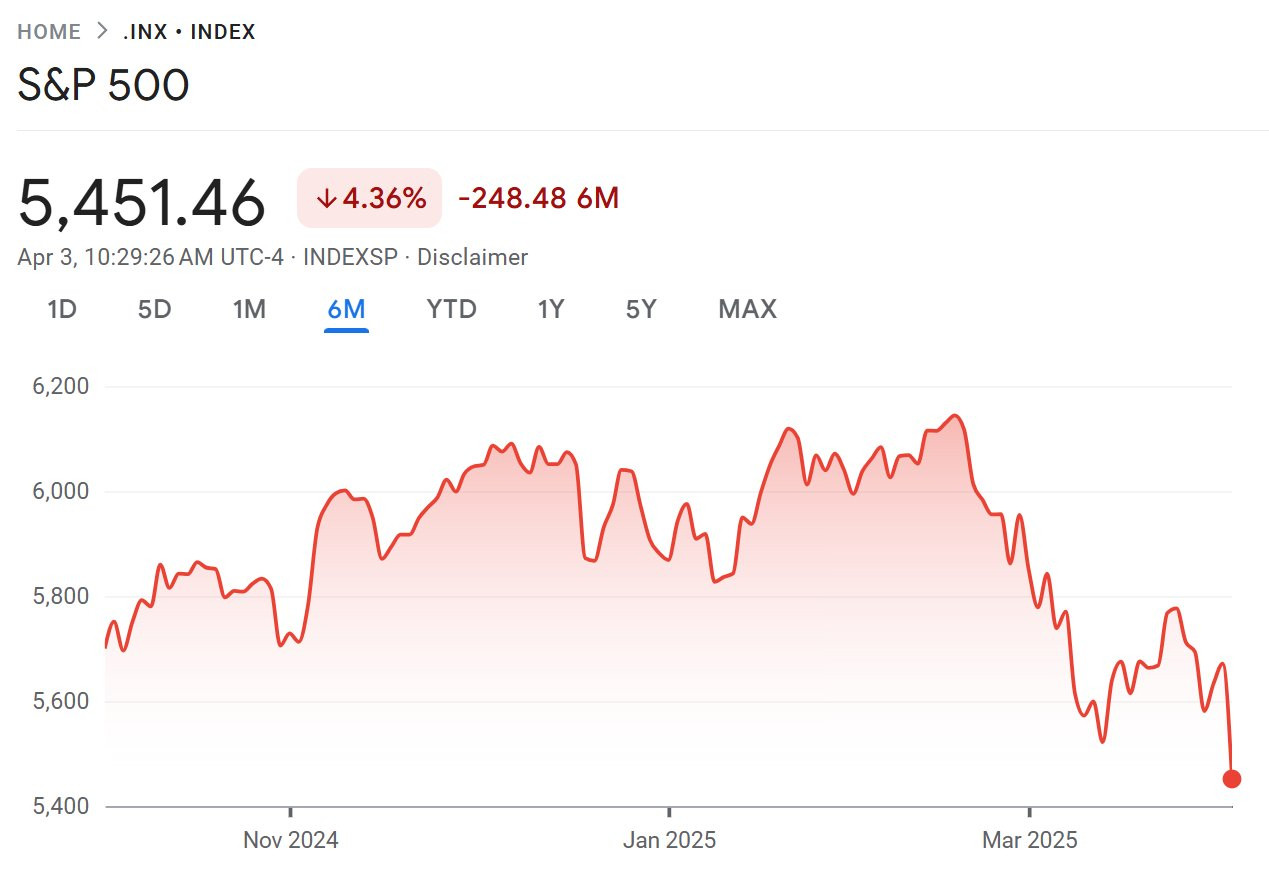
Russell 2000 is now down over 20% from its peak. Nasdaq is down 16.5%. S&P down 12.7%. Hard to see a reason why you want to buy the dip here.


Hey everyone, welcome to the day after! It's the day after "Liberation Day", aka the largest regressive tax increase in American history. Markets are down over 3%.
We'll be joined by Claudia and Ophir, our trusty macroeconomics team, to dissect what these tariffs look like, what it means for the economy, and how we think markets will react over the next couple of months. Join us on X or youtube:
https://www.youtube.com/watch?v=qEO864kbJgE
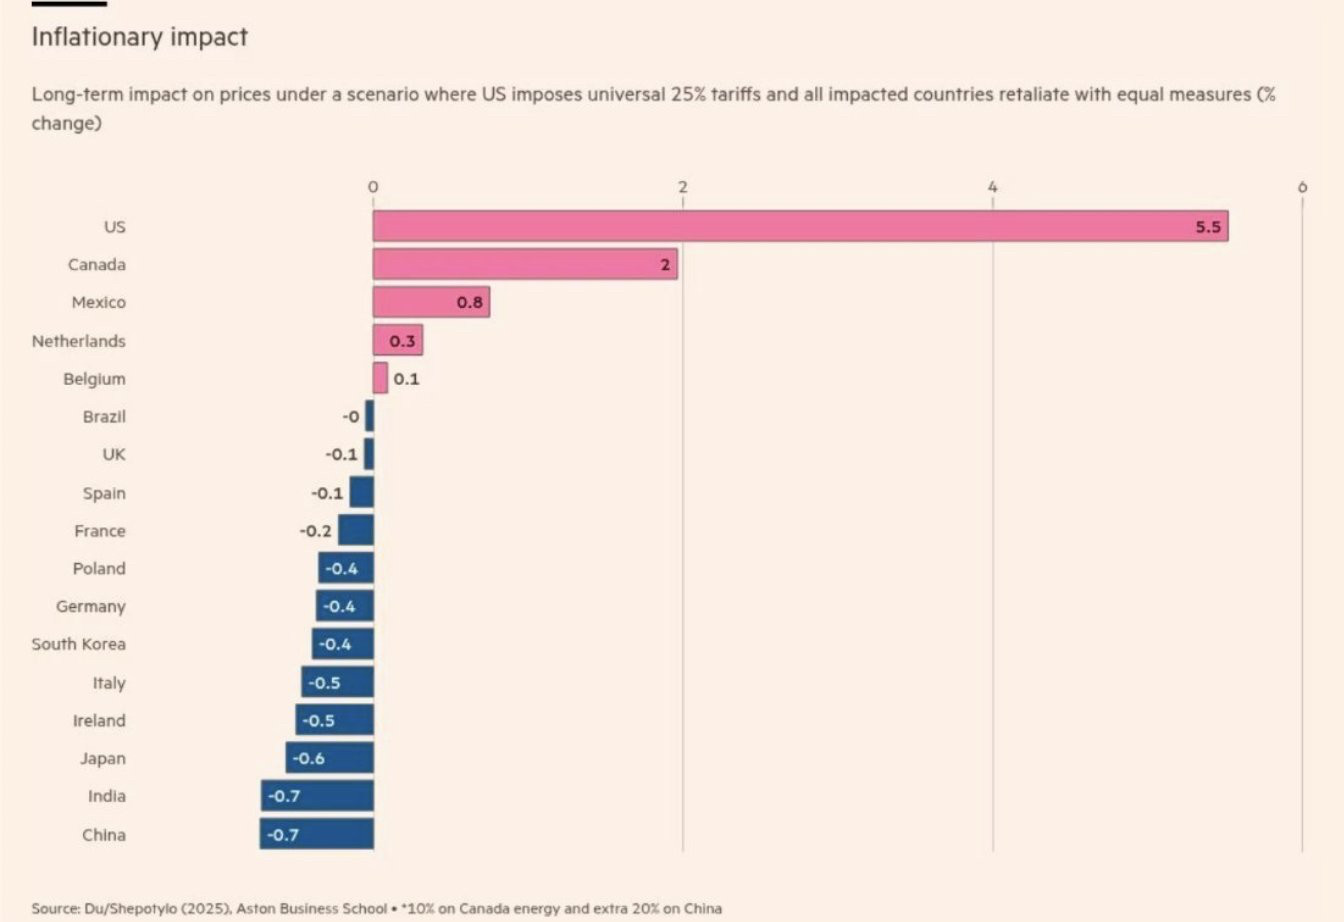
Even more interesting is how this massive tax hike will result in inflation. It will both shrink GDP and increase prices - which is a pretty tough combo to pull off. This can ultimately result in stagflation. Once stagflation starts, monetary policy will struggle.

Besides the obvious problems with this policy, it only targets a bilateral trade deficit of 0 (already completely ridiculous) for goods. In services, we have a massive surplus with the rest of the world. But the policy simply ignores that.
Welcome to liberation day (aka massive, regressive tax increase day). Here are the full tariffs just announced, as markets drop precipitously during the Trump speech. This is much worse than anticipated, and will likely result in significant inflation in the US, and a serious drop in GDP.

